The Request
Help understand and improve user conversion patterns for ecommerce sales of a nationally syndicated television program.
Key Takeaways
Think about new ways to explore, visualize and interpret your data to unlock new strategies.
Overview
We were approached by a national TV network to research ecommerce sales patterns and see where and how media buying strategy could be improved. We were only supplied with ecommerce checkout data and encouraged to explore for hidden insights.
What We Accomplished
- Discovered significant geographical variance in media strategy
- Developed strategic adjustments for urban/rural and north/south media segmentation resulting in:
- Increase in media efficacy
- Millions of dollars in additional sales.
How We Did It
Using order lines from a market-leading national television network and a household brand name show, we converted purchase zip codes to lat/long points and then referenced against third party econometric data from the Federal Reserve.
The analysis was done in R, a dedicated statistics programing language. This allowed identification of regions that were over and underperforming relative to population, and drove key adjustments in media buying and creative targeting on an individual zip code basis.
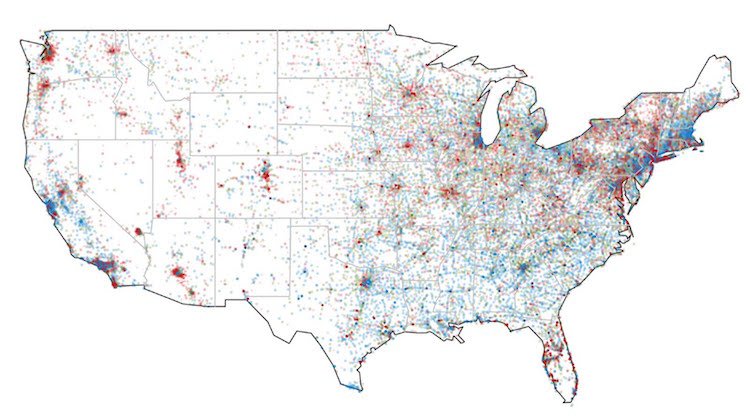
Previous Member Sales Density By Zip
Red = High Sales Per Capita
Green = Average Sales Per Capita
Blue = Low Sales Per Per Capita
