I. Preparation
What do we need to get ready to test?
- Install split testing software. We usually recommend Visual Website Optimizer and can run tests through our account so you don’t need to worry about that.
- Make sure analytics is working, and goals tracking properly so test results can be meaningfully quantified.
- Install any additional heat mapping, session recording, or other analytics data collection.
- Consider informal and qualitative user research as well as hard data.
- Run power analysis on sample size to estimate time needed to run test. How many tests/variants can we run, on what timeline?
In an enterprise setting, you may need to do additional things like testing the quality of your randomization or running tests server side. In very technical settings (i.e. computer science training) you may need to use server side testing as a large percentage of users can block testing software.

JB Analytics’ data-driven approach to search, web design, and testing drove a valuable increase in lead volume and quality. We recommend them to anyone in a technical B2B space.
II. Ideation
What should we test? What are our testing constraints?
- Gather design requirements: brand colors, fonts, and overall visual identity.
- Understand brand requirements and voice.
- Carefully audit all analytics channels.
- Query organization stakeholders about their hunches. What would make users happier? What is stopping them from converting?
- Have business driven conversation defining KPIs – what will really move the bottom line for your business?
- Review several test ideas and rationales.
III. Design & Approval
What exactly will this look like?
We usually design in Figma for client approval and rapid prototyping / collaboration. This allows commenting and iteration for collaborative processes.
Some tests desktop only, some mobile, some both.
IV. Implementation & Testing
How do we mock the test up, do appropriate QA and run it?
- Create page either as a static stand alone, or in VWO depending on test complexity.
- Perform QA across mobile, desktop and tablet for major browsers, iOS and Android.
- Set up appropriate data collection, usually making use of custom variables in Google Analytics as well as VWO’s native analytics. This allows for a holistic view of all metrics and not just KPIs.
- Allow test to run until statistical significance is reached, monitoring results carefully.
V. Analysis & Interpretation
Did our test win? What have we learned?
- Extract the data, usually via the Google Analytics API into a shareable Google Sheet.
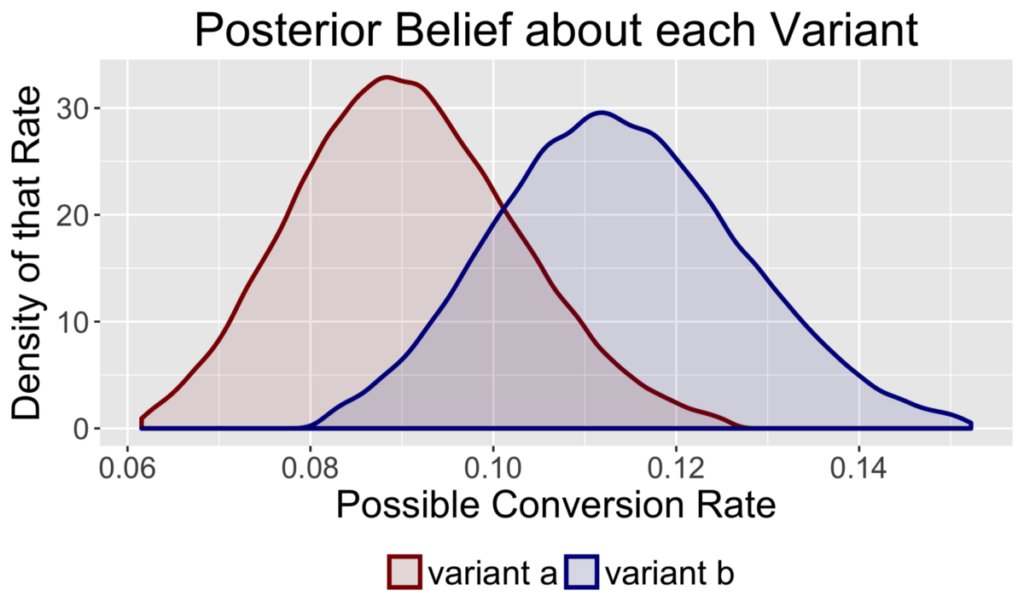
- Calculate uncertainty intervals, expected conversion rates, significance, and p values.
- Present results holistically in terms of all relevant GA variables, and not just outcome variables. If sample is large enough, consider cohort sub-analysis.
- Calculate cost/benefits of implementation.
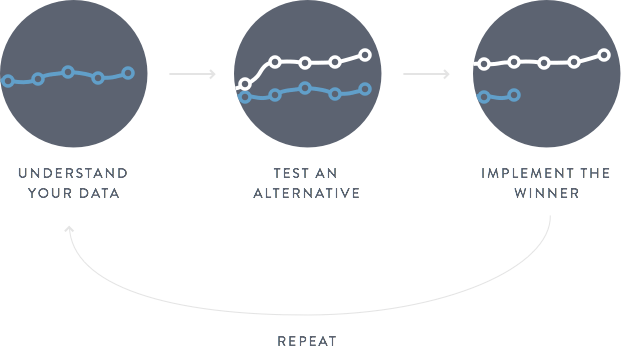
VI. Iteration
What is next? How do we keep improving rapidly?
- Implement winning variations, learn from null and losing tests.
- Go to start of testing process. Repeat!
Amazon has been testing for over 20 years and is still seeing gains.
